
How to use instagram insights to measure your account’s performance?
What are instagram insights?
| Instagram Insights is a powerful tool that can help you track your account’s performance and engagement. It provides valuable data on your followers, post reach, and engagement, which can help you make better-informed decisions about your content strategy. |
Why use this tool?
| Instagram insights are valuable for creators as they provide data on audience demographics, content performance, optimal posting times, story effectiveness, follower growth, and promotion insights, helping creators understand their audience and improve their content strategy for maximum engagement and growth. |
Instagram insights offer detailed demographic information about the followers, including age, gender, location, and online activity. This data helps creators gain insights into their target audience, allowing them to tailor their content to better resonate with their followers.
The Instagram engagement icons, namely likes, comments, shares, and saves, are essential for creators as they signify different aspects of audience engagement. Likes demonstrate overall interest and appreciation for the content, comments indicate direct interactions and conversations, shares expand the reach to a wider audience, and saves reflect content value and long-term relevance. Each icon plays a crucial role in measuring and understanding the impact and resonance of the content with the audience, helping creators assess their performance and make informed decisions for content optimization.
When you tap on the “View Insights” button on an Instagram post, a new page will show up with four icons, each representing different types of engagement, along with numbers beneath them. Let’s understand the how’s first in simple words.
| Likes | How many people have liked your post? |
| Comments | How many comments on your post? |
| Shares | How many times has your post been shared by others? |
| Saves | How many times have people saved your post? |
Likes, comments, shares, and saves are valuable for creators on social media platforms like Instagram because they indicate the level of engagement and interest that their content generates among their audience. When someone likes a post, it means they appreciate or enjoy the content. It’s like giving a virtual thumbs-up or showing support to the creator. Likes can boost a creator’s confidence and provide positive feedback on their work. Comments can spark conversations, allow for interaction, and help creators understand what their audience likes or wants to see more of. When someone shares a post, it means they find it interesting or valuable enough to pass it along to their own followers. Saves are like bookmarks on social media. When someone saves a post, they can come back to it later, as it caught their attention or they found it helpful. Let’s understand all of this with the help of some screenshots:
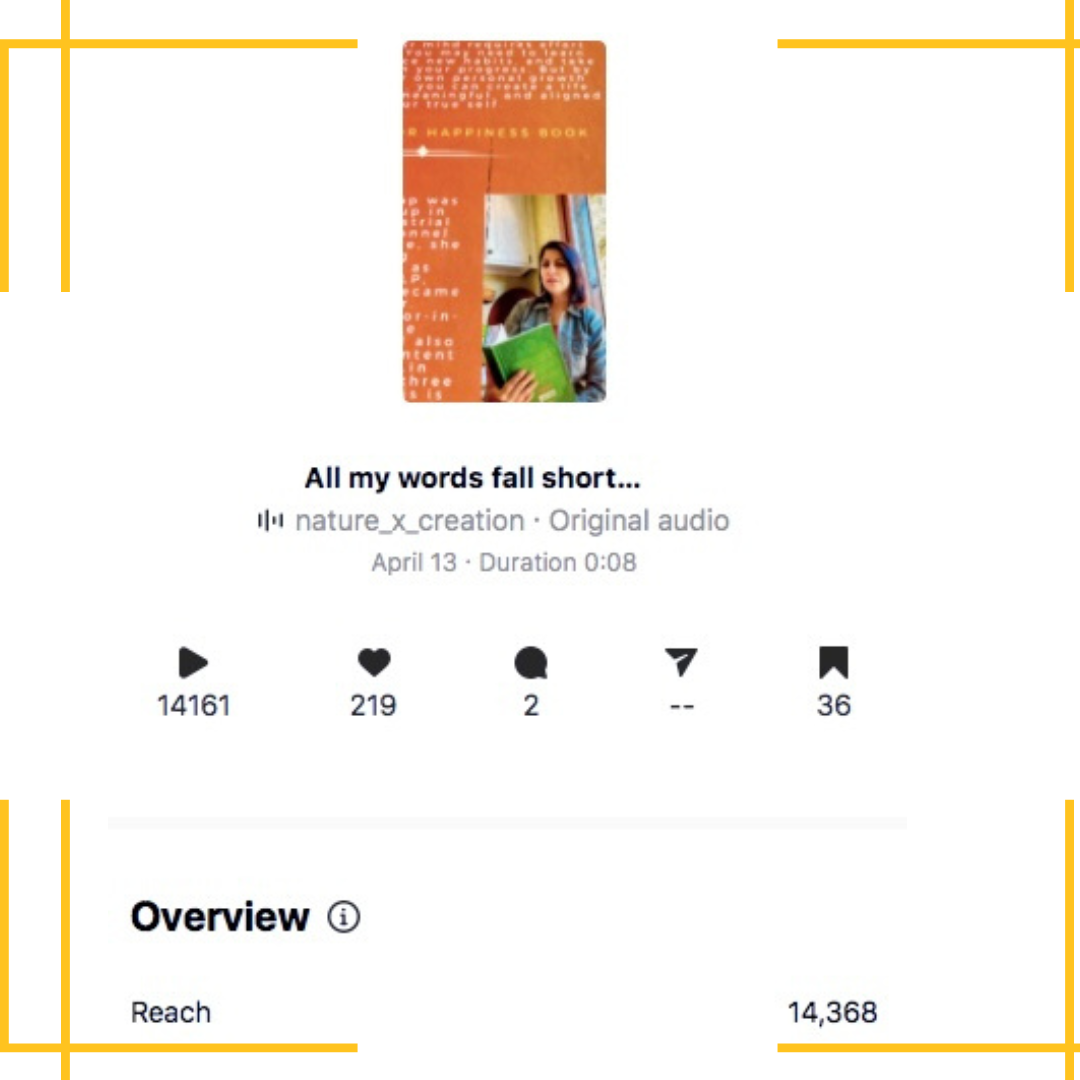
The heart ♥️ icon that we see above represents the number of likes that were received for the video reel. Reel received 219 likes. This indicates that people appreciated and enjoyed the content.
The play icon ▶️ : The video was played 14,161 times. This metric shows how many people viewed the Reel. It reflects the reach and visibility of the content, indicating that it caught the attention of a significant number of Instagram users.
The comment icon:🗨️There were 2 comments on the Reel. Comments represent direct interactions and conversations with your audience. Although the number is relatively low, it still indicates some engagement and provides an opportunity to engage with the followers further.
Share icon: ↗️There were no shares for this Reel. While shares can help increase the reach of your content, the absence of shares doesn’t necessarily indicate a lack of interest. It’s possible that the content didn’t resonate strongly enough for viewers to share it.
Save icon: The Reel was saved 36 times. Saves demonstrate that viewers found the content valuable and wanted to refer back to it later. It suggests that the Reel has a lasting impact and holds value for the audience.
These insights offer a glimpse into how the post performed and the level of engagement it generated. While the number of comments and shares may be relatively low, the number of likes, video plays, and saves indicate a positive response from the audience. Take these insights into account as you continue creating content, and consider experimenting with different approaches to further enhance engagement.
Remember, engagement metrics can vary from post to post, and it’s essential to analyze trends over time to gain a comprehensive understanding of your audience’s preferences. Keep experimenting, engaging with your followers, and refining your content strategy to achieve even greater success on Instagram.
Now the question is: How do you start using these insights in your instagram account. There are a couple of steps for the same.
Here’s a step-by-step guide on how to use Instagram Insights:
Step 1: Switch to a Professional Account
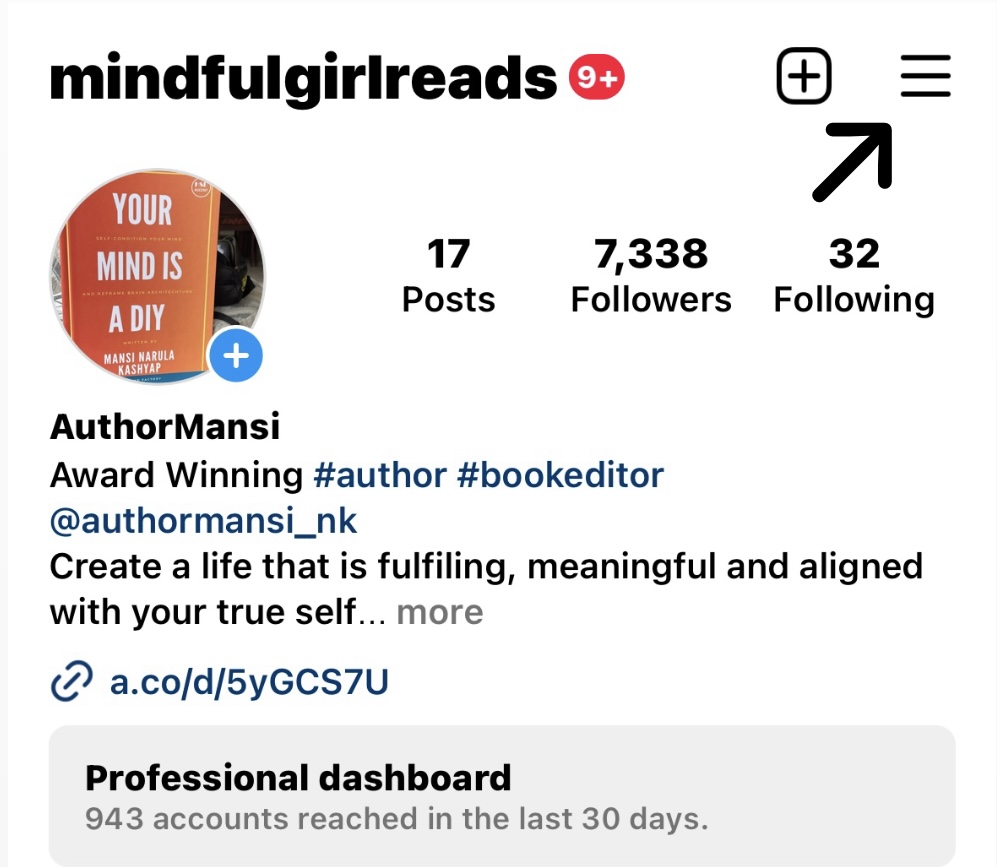
To access Instagram Insights, you need to have a Business account on Instagram. If you already have a personal account, you can switch to a Business account by going to your profile and tapping the three lines in the top right corner. From there, select “Settings” and then “Account.” Finally, select “Switch to Professional Account” and follow the prompts to set up your Business account. See screenshots below for your reference:
1-) Click on the three lines icon on the top right corner of your profile.
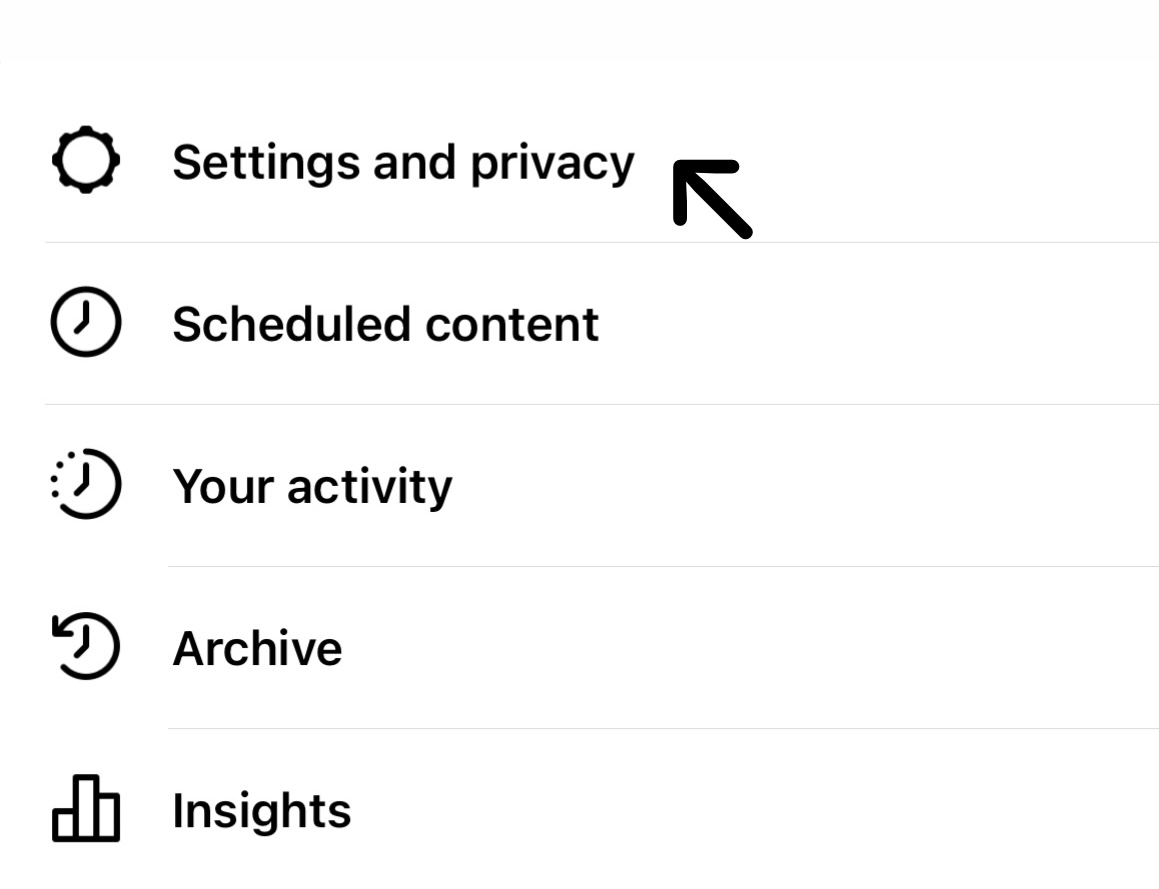
2-) Next, go to ‘Settings and Privacy’ Tab
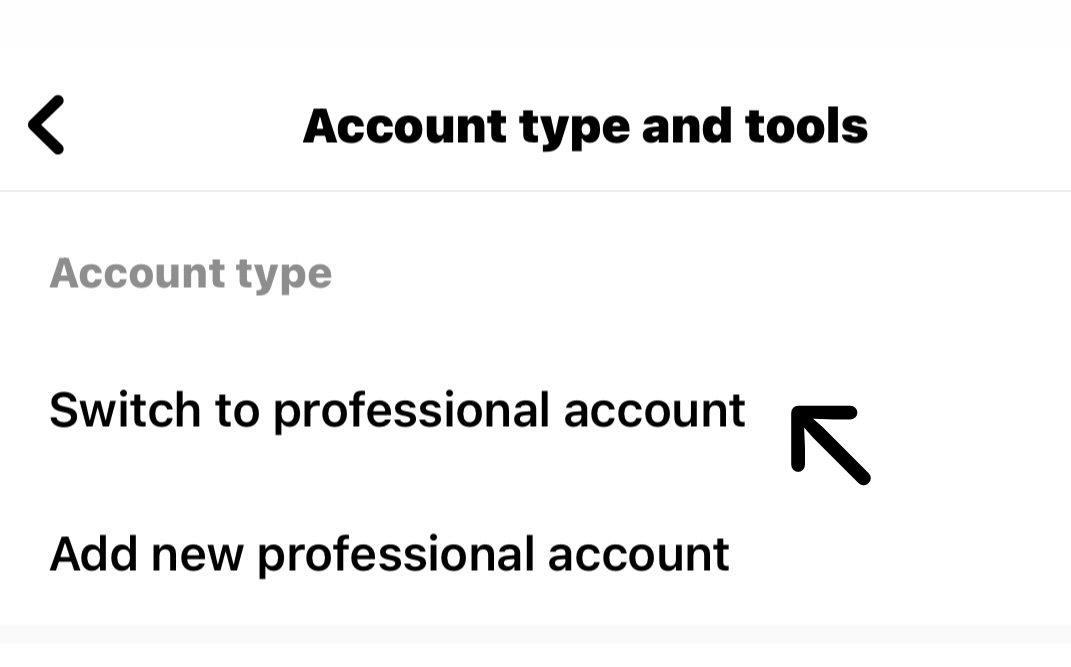
3-) Now, go to the ‘Account types and tools’ tab and click on Switch to Professional account.
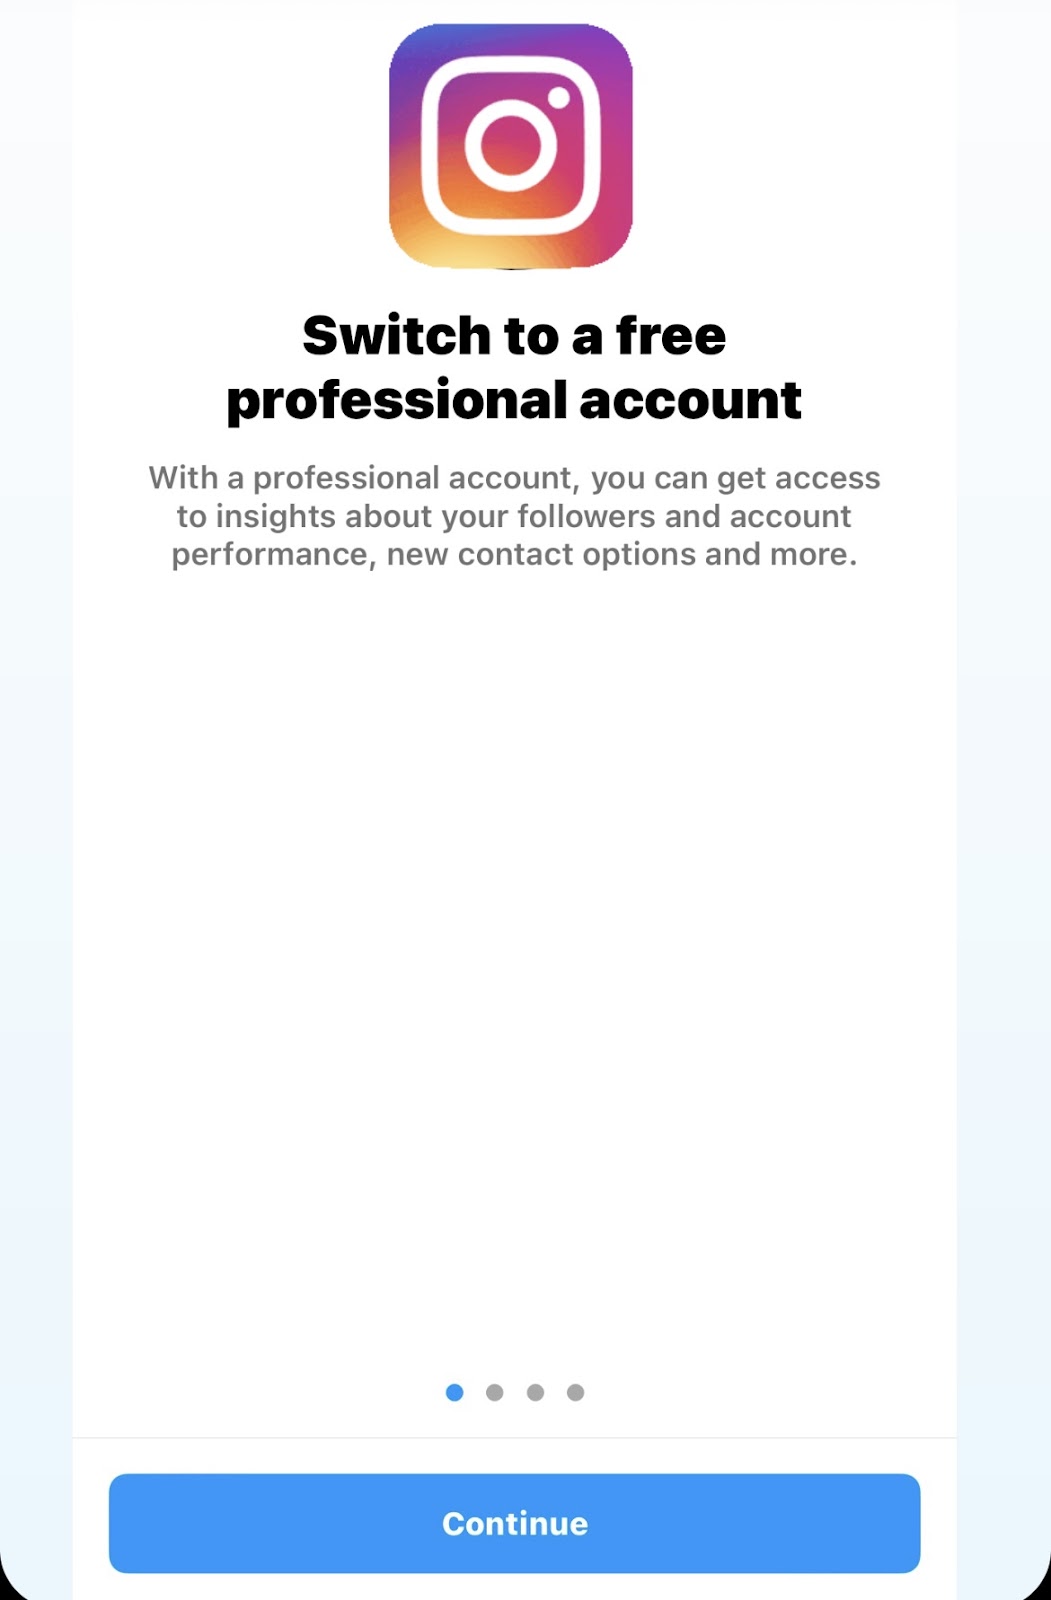
4-) Once you get into the professional account page, Instagram will ask you to continue. Click continue and you are all set. The screenshots given below for your reference.
Step 2: Access Instagram Insights
Once you’ve switched to a professional account, you can access Instagram Insights by going to your profile and tapping the three lines in the top right corner( as shown above in step 1). From there, select “Insights” to access your account’s analytics.
Step 3: Account Analytics Explained:

In the screenshot above, you can see Accounts Reached: The “accounts reached” insight on Instagram refers to the number of unique user accounts that have seen your content within a specific time period. It shows how many people had your posts or stories appear on their Instagram feed or explore page. This metric helps you understand the overall visibility and reach of your content. It is important to note that “accounts reached” counts each unique account only once, regardless of how many times they may have seen your content.
In the above screenshot you can see Accounts Engaged:
The “accounts engaged” metric on Instagram shows how many different people interacted with your content during a certain time. Interactions can include things like liking, commenting, saving, or sharing your posts. This metric helps you see how much people are interested in and interact with your content. It tells you if your posts are getting attention and if people are engaging with them. It’s a way to measure how well your content is doing in getting people involved and interested.
In the above screenshot you can also see Total Followers:
“Total followers” means the total number of people who have chosen to follow your Instagram account. It shows how many people are subscribed to see your posts on their Instagram feed. This number tells you how many people are interested in your content and want to keep up with what you share. Having more followers means more people can see your posts, which can lead to more likes, comments, and interactions.
The number of accounts reached was 18, meaning that the content was seen by 18 different users. Out of those, only 1 account engaged with the content, indicating a lower level of interaction. The total number of followers for the account is 7,339, representing the overall audience size.
Don’t forget, the numbers that measure how people interact with your posts can be different for each post. It’s important to look at patterns over a long period of time to really understand what your audience likes. Keep trying new things, interacting with your followers, and improving your plan for what you share to do even better on Instagram.
Step 4: Analyze Your Data
Once you have access to your account’s analytics, take some time to analyze your data. Look for trends and patterns in your performance metrics, and use this data to make informed decisions about your content strategy. For example, if you notice that your engagement is higher on certain types of posts, you may want to focus more on creating that type of content in the future. Let’s study the example below for more understanding which will show you the data for the last seven days. You can choose the data cycle as last seven days, last 14 days, last 30 days or last 90 days as well. So what is the reach for the creator in the below screenshot?
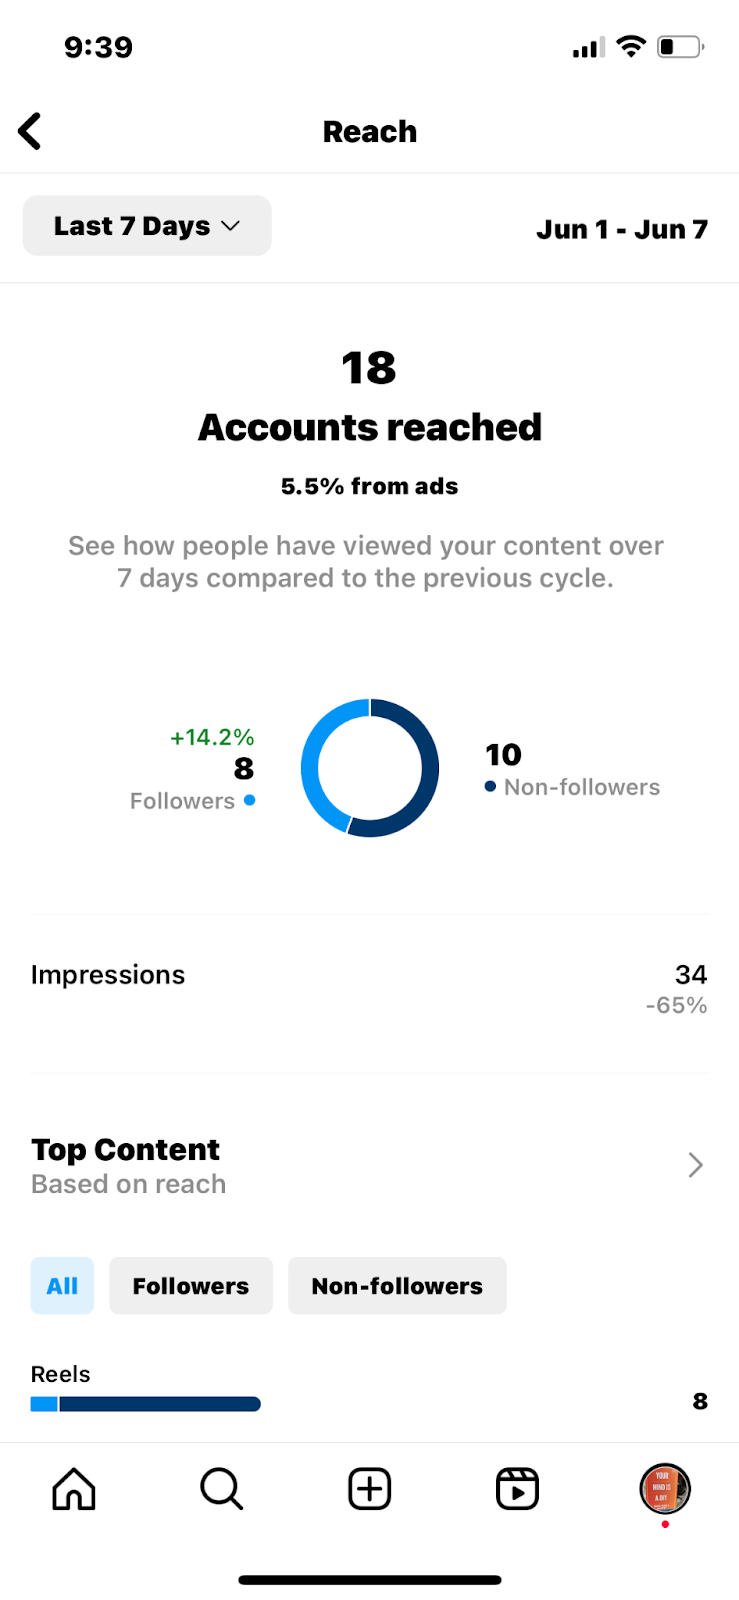
In the above screenshot, a total of eighteen accounts were reached in the last 7 days, out of which 5.5% reached from Ads. Out of those 18 accounts, 8 were your followers and 10- non-followers.
Right below the reach metrics you can see the Impression button. “Impressions” refers to the total number of times your content, such as posts or stories, was displayed on screens. It counts every instance when your content was viewed, regardless of whether it was seen by the same person multiple times. For example, if a post appears on someone’s Instagram feed and they scroll past it, that counts as one impression. If they scroll back up and see the post again, it counts as another impression. The above screenshot shows 34 impressions in total.
This metric helps you understand the general level of awareness and attention your posts are receiving, which can be useful in evaluating the effectiveness of your content strategy and optimizing your reach to a wider audience.
Engagement Analysis:
We have studied the audience reached tab in detail above. Now, lets click on the audience engagement tab from the same screen and understand how engagement helps us build our community.
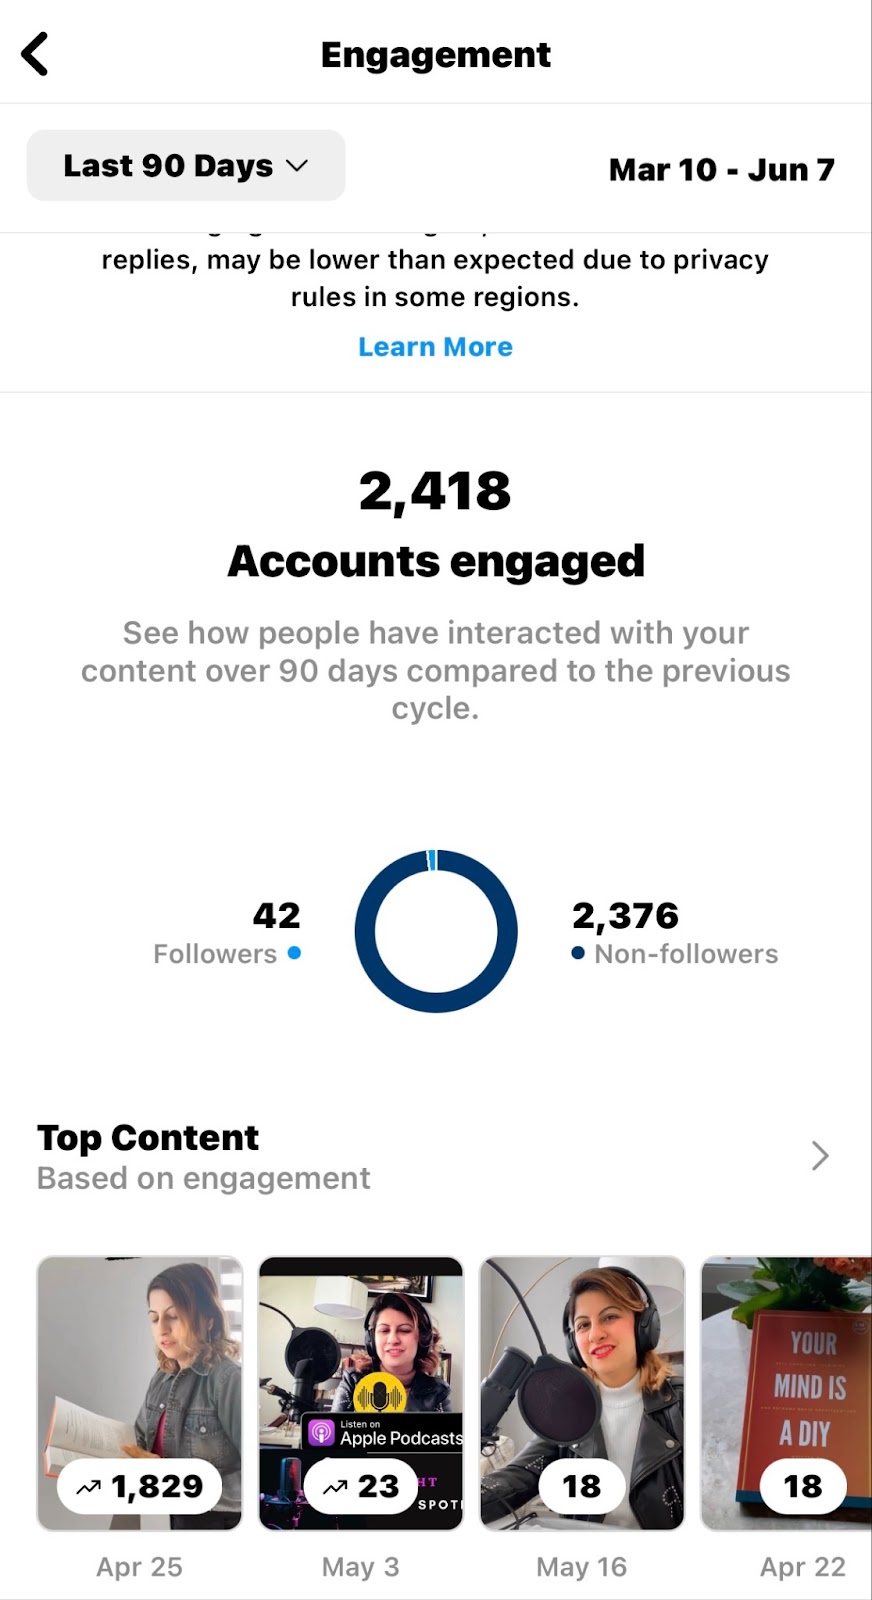
In the above screenshot, a total of 2,418 accounts engaged with the content. Among them, 42 were followers of the account, while the remaining 2,376 were non-followers. This shows that a significant portion of the engagement came from users who are not currently following the account.
When examining the top content based on engagement, the first post stood out with 1,829 accounts engaged. This post garnered the highest level of interaction and captured the attention of a large number of users. The second post received engagement from 23 accounts, while the third and fourth posts had 18 accounts engaged each.
This analysis highlights the importance of creating content that resonates with both followers and non-followers. While the first post received the most engagement, it is essential to understand the factors that made it successful and replicate those elements in future content. By studying the engagement patterns, you can gain insights into the preferences of your audience and tailor your content strategy accordingly to maintain and increase engagement levels.
Followers Count Analysis:
Now, let’s delve into some more details about who all visited your profile and from where?
Let’s study the followers count in the screenshot above:
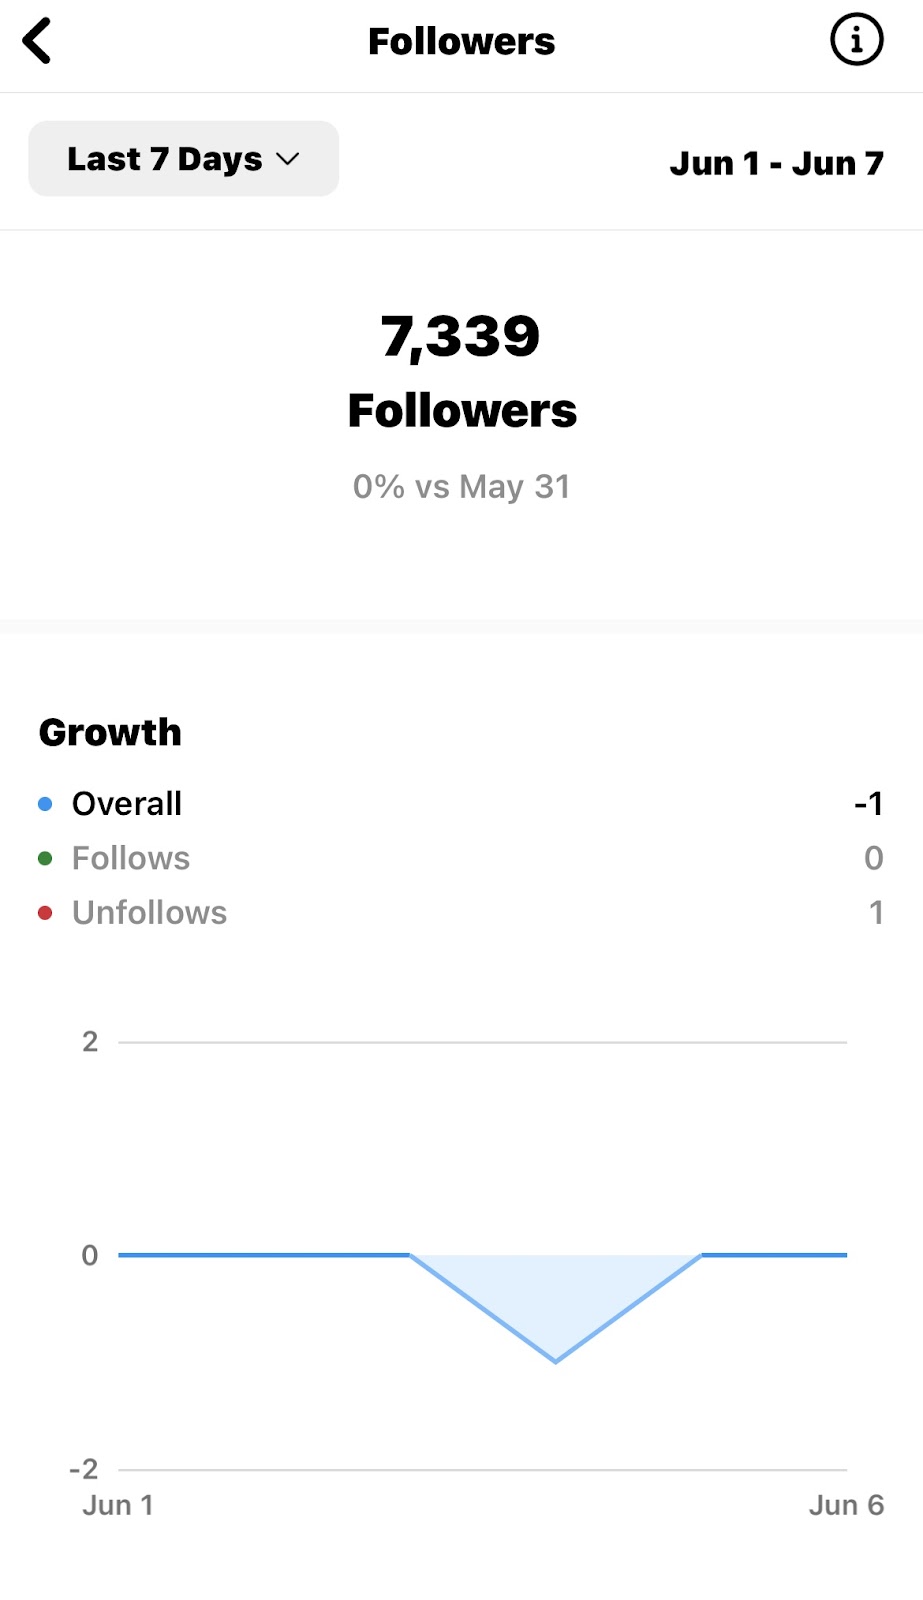
In the followers study, the total number of followers is 7,339. Compared to May 31, there hasn’t been any change in the number of followers.
During the past seven days, there has been a small decrease of 1 follower in the overall growth. This means that the account has lost one follower recently.
In terms of gaining new followers, there hasn’t been any change in the number of people following the account. No new followers have been added in the past week.
However, one person has decided to unfollow the account, which means they have stopped following it.
This followers study shows that while the total number of followers has stayed the same, there has been a slight decrease due to one person unfollowing. It’s important to keep an eye on these numbers and understand follower behavior to adjust your content or engagement strategies and continue attracting more followers.
TOP locations analysis:
In the location analysis for Instagram, we have gathered some insights on the top locations and countries associated with the account. It would be so interesting to know who visited your profile from which corner of the world. It helps you keep your audience for a long time, and make global connect with your niche community.
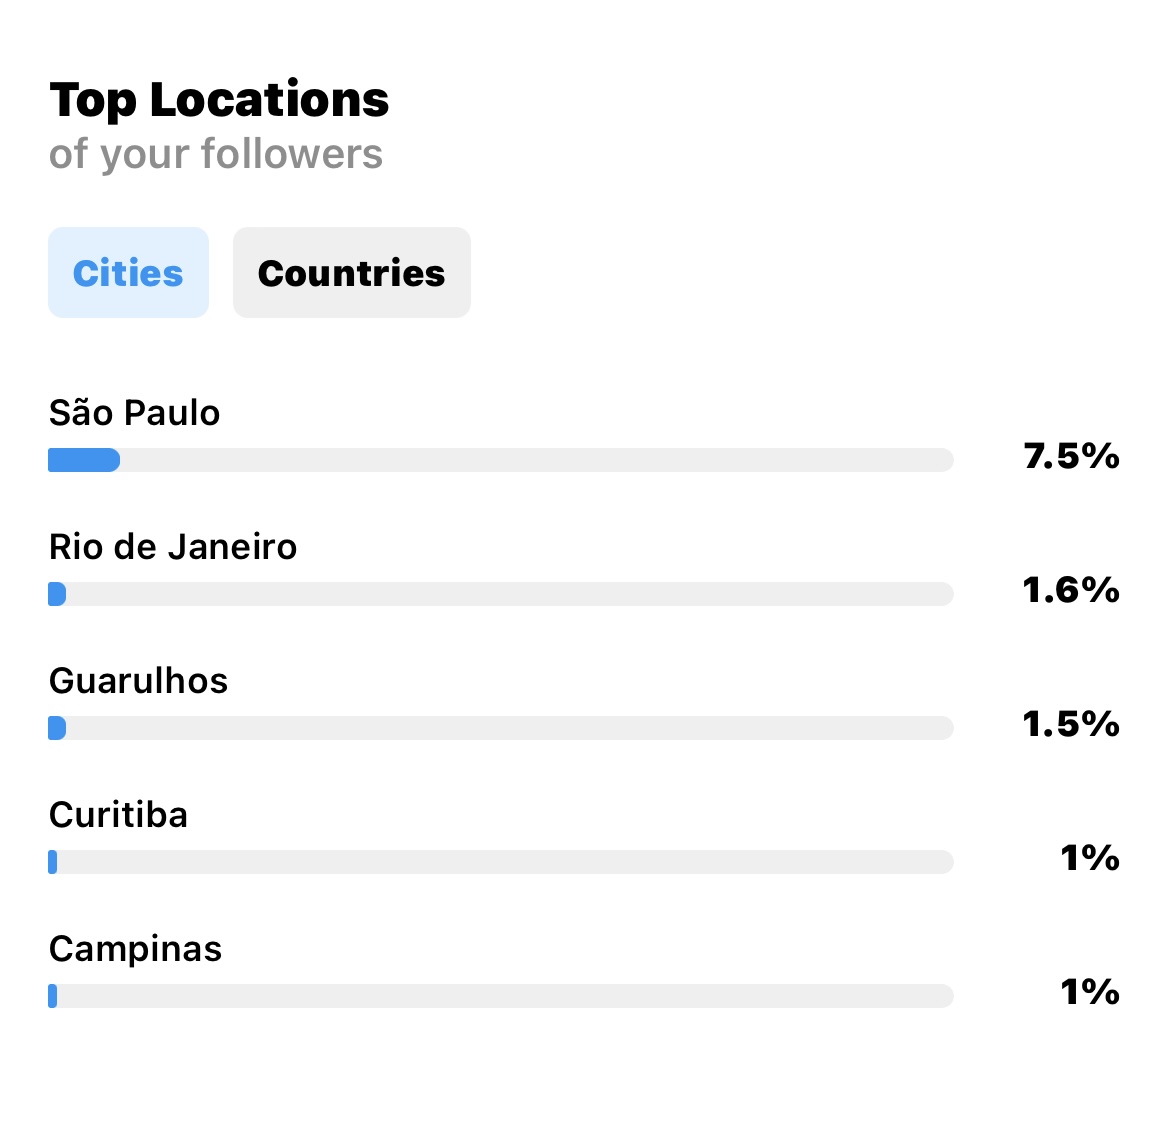
The data reveals that Sao Paulo represents 7.5% of the total engagement. It appears to be a significant hotspot for the account’s audience. Coming in second place, Rio de Janeiro accounts for 1.6% of the engagement. It shows a decent level of interest from users in this area. Curitiba and Campinas accounts for 1% of the engagement.
If you click on the country tab right next to cities, you will see which all countries have the highest engagement levels for your account.
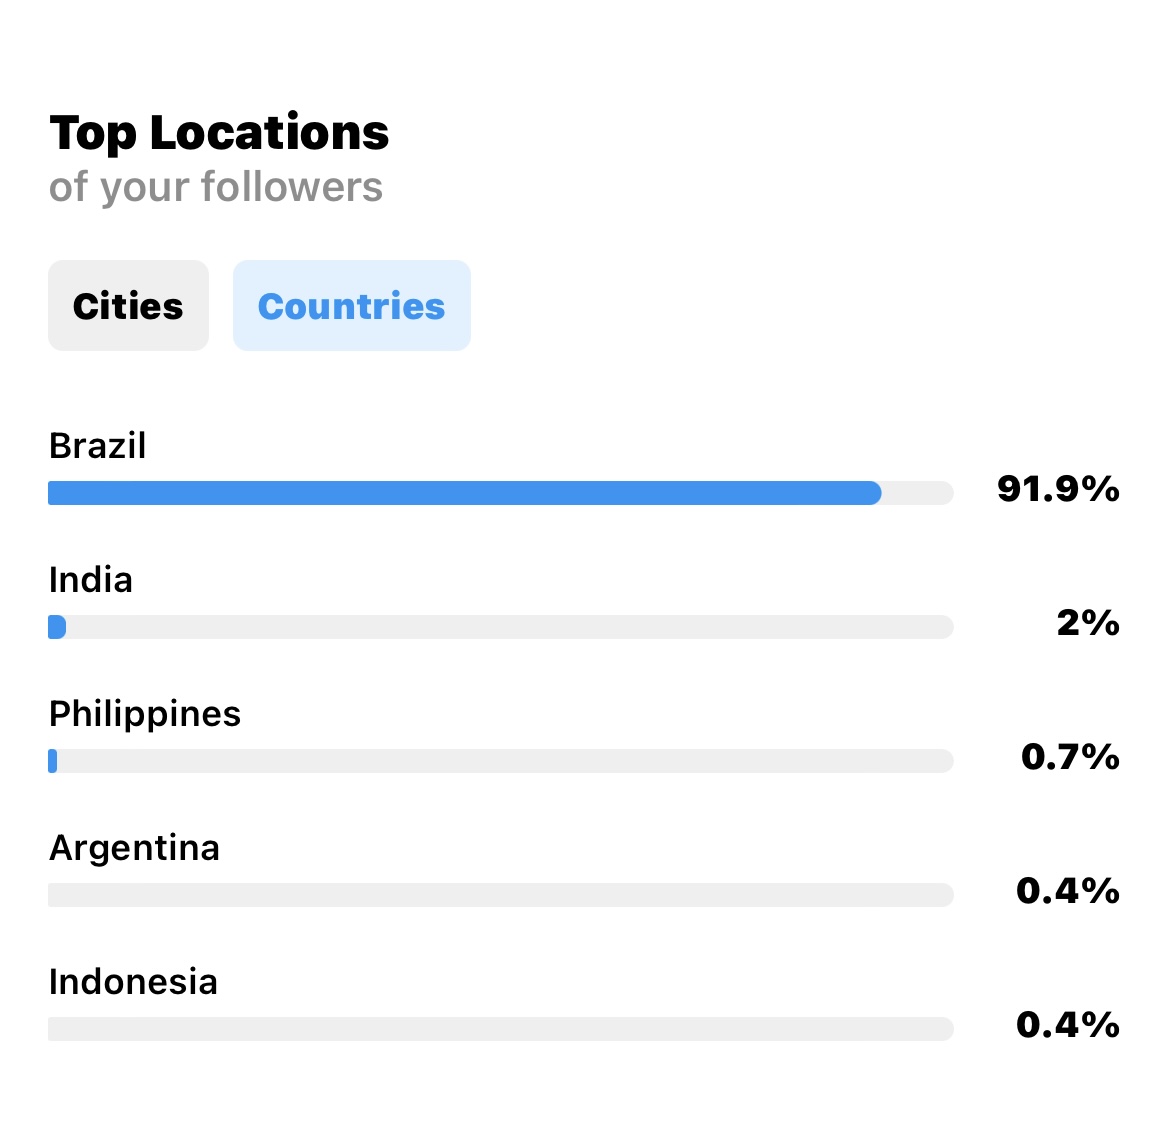
In the above screenshot, Brazil scores 91.9% as your audience. It clearly has a strong and engaged user base for the account. India with 2% of the engagement, holds the second position. It shows a significant interest from users in India. These location insights provide valuable information about the account’s audience distribution. It suggests that the majority of the engagement comes from locations within Brazil, particularly São Paulo. Additionally, countries like India, the Philippines, Argentina, and Indonesia also contribute to the account’s reach and audience. Understanding these location trends can help tailor content and engagement strategies to better connect with the target audience in each location or country.
Age range analysis:
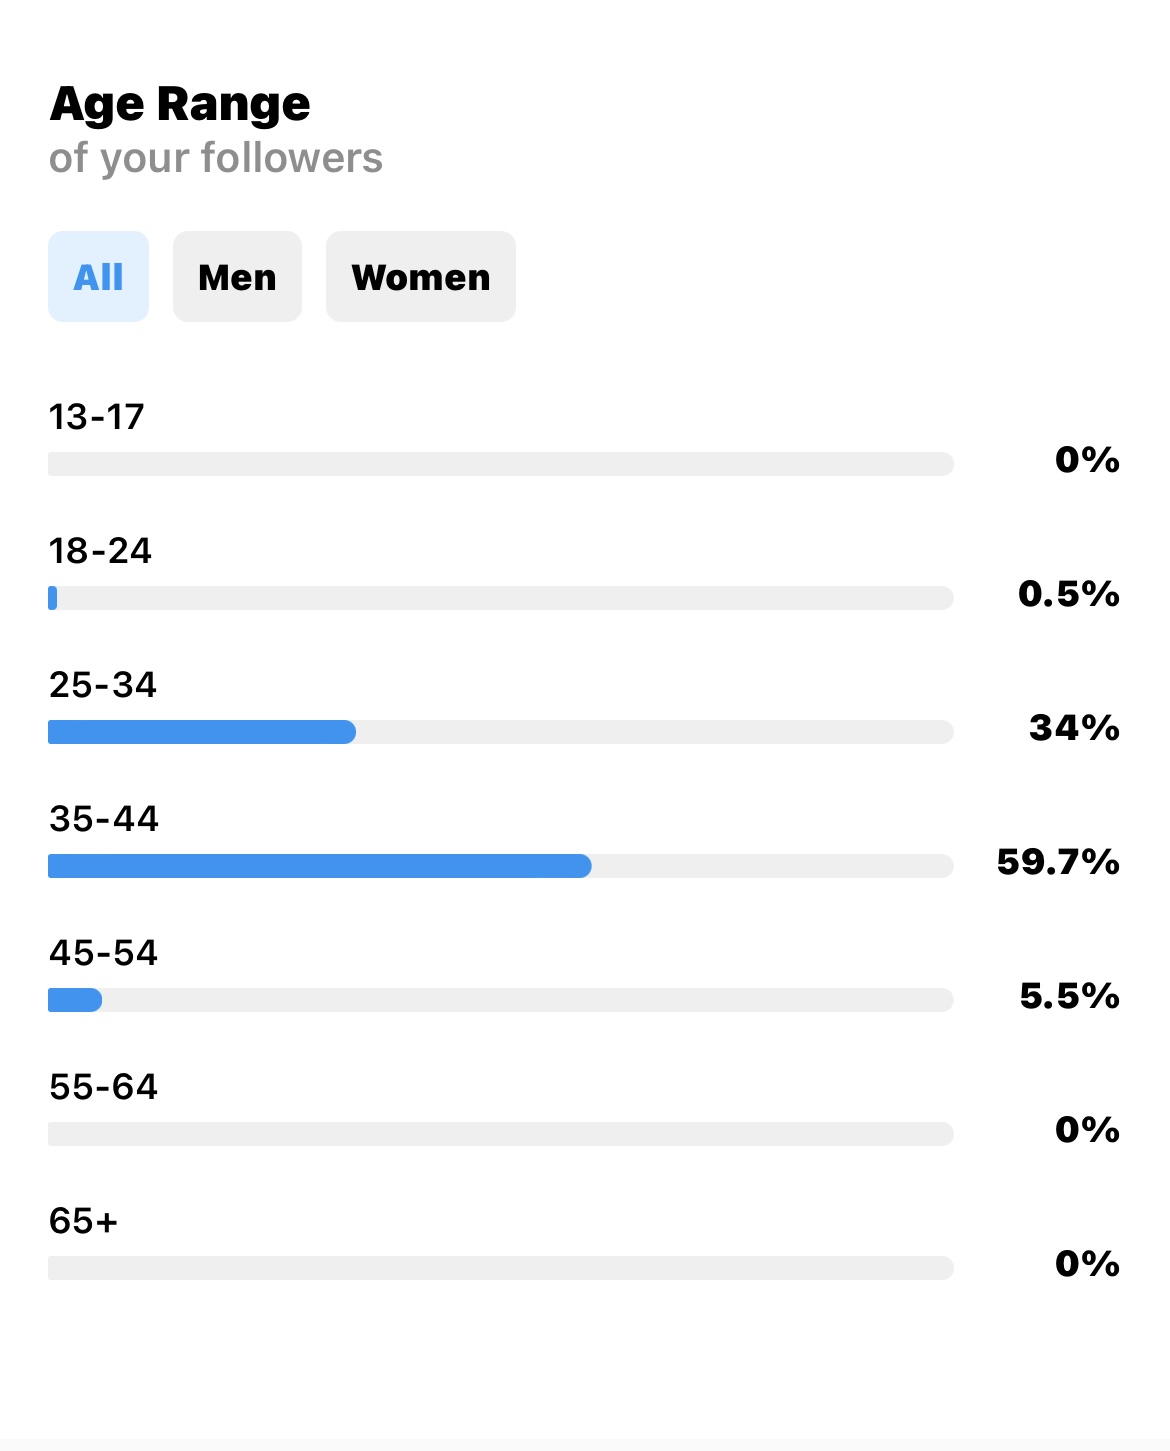
In the age range analysis, we have gathered insights about the distribution of age groups among the account’s audience. The above data reveals the following information:
25-34: This age group represents 34% of the audience. It shows a significant presence and engagement from individuals between the ages of 25 and 34.
35-44: Coming in as the largest age group, this range accounts for 59.7% of the audience. It indicates a substantial majority of users falling within the 35-44 age bracket.
45-54: With a smaller percentage, this age group represents 5.5% of the audience. While it is a minority compared to the other groups, it still indicates some engagement from individuals aged 45 to 54.
13-17 and 55-64: These age ranges show zero engagement, suggesting that there is no representation or activity from users aged 13 to 17 or 55 to 64.
These age range insights provide valuable information about the distribution of the account’s audience. It reveals that the majority of the engagement comes from individuals between the ages of 35 and 44, followed by the 25-34 age group. This suggests that the content and messaging may resonate particularly well with these age groups. It is also notable that there is minimal to no engagement from individuals aged 13 to 17 and 55 to 64.
Understanding these age range trends can help tailor content, marketing strategies, and communication styles to better connect with the primary audience and target demographic. By focusing on the age groups that show the highest engagement, the account can optimize its efforts to effectively reach and communicate with its core audience.
Gender analysis:
Gender analysis on Instagram is a metric that provides insights into the distribution and engagement of different genders among an account’s audience. This analysis helps understand the composition and preferences of the followers based on gender. While Instagram does not explicitly provide gender information for individual accounts, it uses algorithms and user-provided data to estimate the gender of the audience.
By examining the gender analysis, one can gain insights into the gender breakdown of the account’s followers and their engagement levels. This information can be valuable in tailoring content and marketing strategies to resonate with the specific gender demographics.
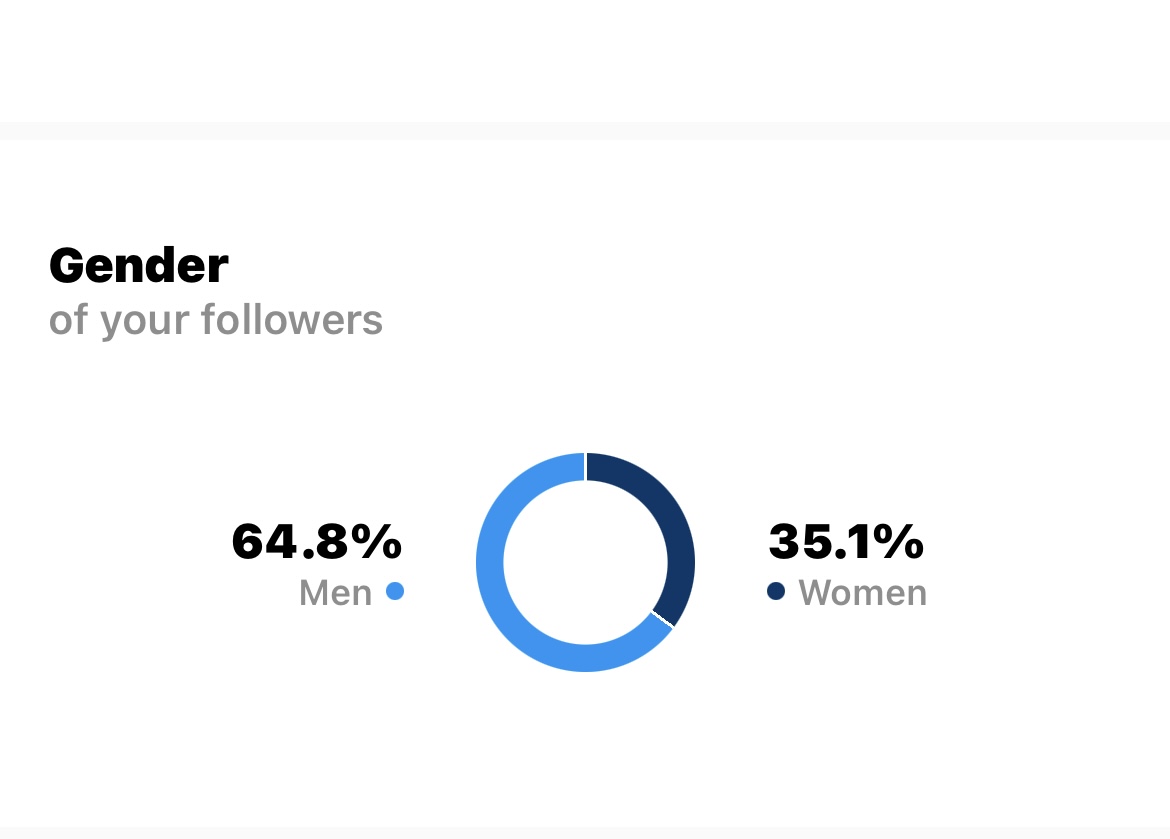
The gender analysis for the above Instagram account reveals that women make up 35.1% of the audience, while men account for 64.8%. These figures indicate a higher representation of male followers compared to female followers.
However, it is essential to consider that engagement and interests can vary among individuals, regardless of gender. It is crucial to regularly monitor audience feedback, analyze content performance, and adapt strategies accordingly to ensure engagement and satisfaction among all followers.
Active Times Analysis:
Active time analysis on Instagram refers to the process of examining when your audience is most active and engaged on the platform. This analysis helps you determine the specific times and days when your followers are likely to be online, increasing the chances of your content reaching and resonating with them.
By studying the active time patterns, you can optimize your posting schedule to align with the periods when your audience is most active. This can lead to higher visibility, engagement, and interaction with your posts.
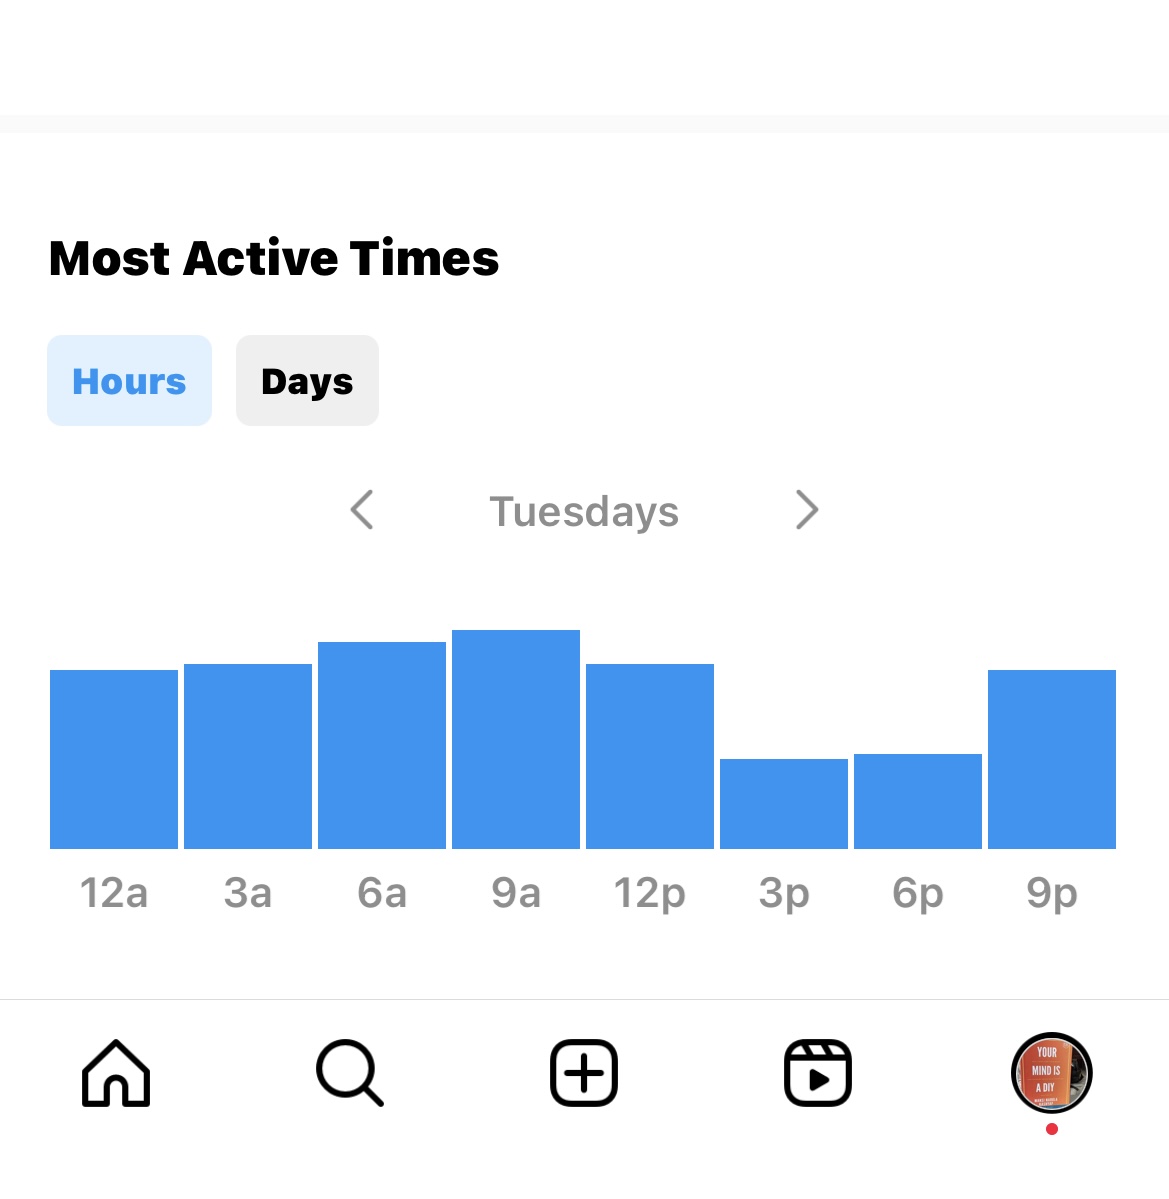
For example: The above analysis indicates that the highest levels of activity and engagement occur at 9 am and 6 am. During these times, a significant number of users are active on the platform, indicating optimal opportunities to reach and engage with your audience.
On the other hand, the analysis suggests that user activity is relatively lower at 3 pm and 6 pm. These times may have fewer users actively browsing or engaging with content on Instagram.
Finally, the analysis shows that user activity during the evening at 9 pm falls in the medium range. This indicates that there is a moderate level of user activity and engagement during this time period.
By understanding the active time patterns, you can strategically plan your content and posting schedule. Posting during the peak times of 12 am, 12 pm, and 9 am can help increase the visibility and engagement of your posts. However, it’s important to note that these patterns may vary based on your specific audience, location, and niche. Regularly monitoring and analyzing your audience’s active time can provide valuable insights for optimizing your content strategy and maximizing audience reach and engagement.
Step 5: Make Changes to Your Strategy
Last but not the least, make changes to your strategy as per your insights and engagement metrics. For example, if you notice that your audience is primarily located in a certain region, you may want to create content that is targeted to that specific audience. Or, if you notice that your engagement is higher on certain days of the week or at certain times of day, you may want to adjust your posting schedule to optimize your engagement.
Instagram Insights is a valuable tool for tracking your account’s performance and engagement. By accessing your account’s analytics, analyzing your data, and making changes to your content strategy, you can improve your account’s performance and reach a larger audience.
Sign up on www.kosmc.ai and discover creator tools to level up your creator game!


Leave a Reply